VirusTotal released a new feature today that allows a user to visualize data associated with a submitted file. Using this tool, a user can easily see information such as the hosts the file connects to, what files it creates, and more. Even better, this new tool is available to all members and not only to subscribers of VirusTotal's premium Intelligence platform.
Called
Graph, VirusTotal explains that this visualization tool can help a user understand the relationship between different data associated with a submitted file.
It is a visualization tool built on top of VirusTotal’s data set. It understands the relationship between files, URLs, domains and IP addresses and it provides an easy interface to pivot and navigate over them.
By exploring and expanding each of the nodes in your graph, you can build the network and see the connections across the samples you are studying. By clicking on the nodes, you can see at a glance the most relevant information for each item. You can also add labels and see an in-depth report by going to VirusTotal Public or VirusTotal Intelligence report.
You can get to VirusTotal Graph by either going directly to the url
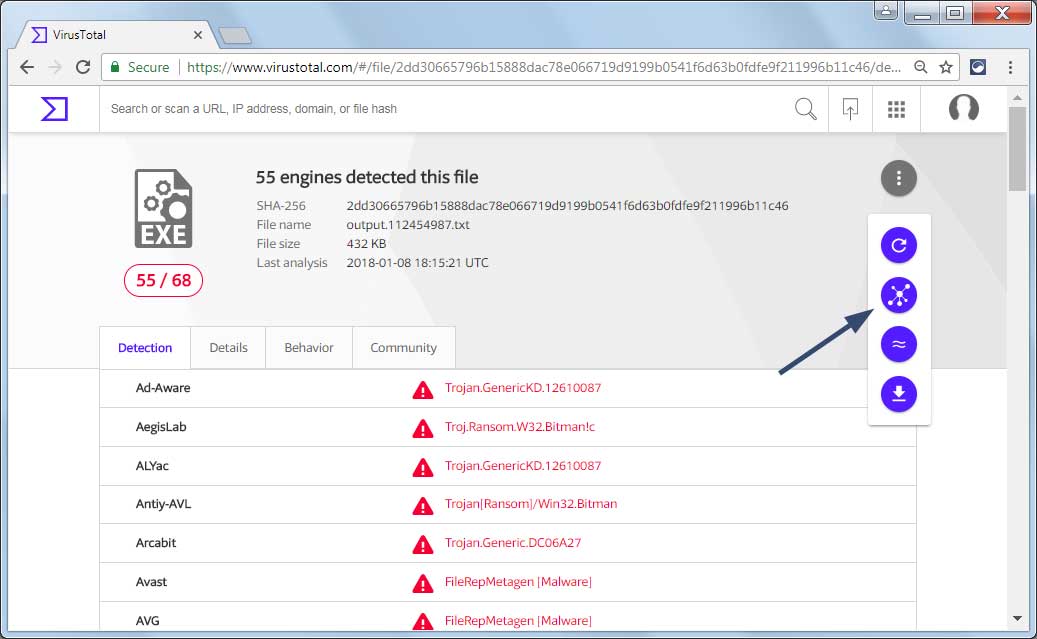
VirusTotal Graph and submitting a known hash or going to the analysis page of a particular file. In the analysis page is a new option under the dropdown menu labeled Open in VirusTotal Graph, which brings you to the page's Graph page.
Accessing a Submission's Graph
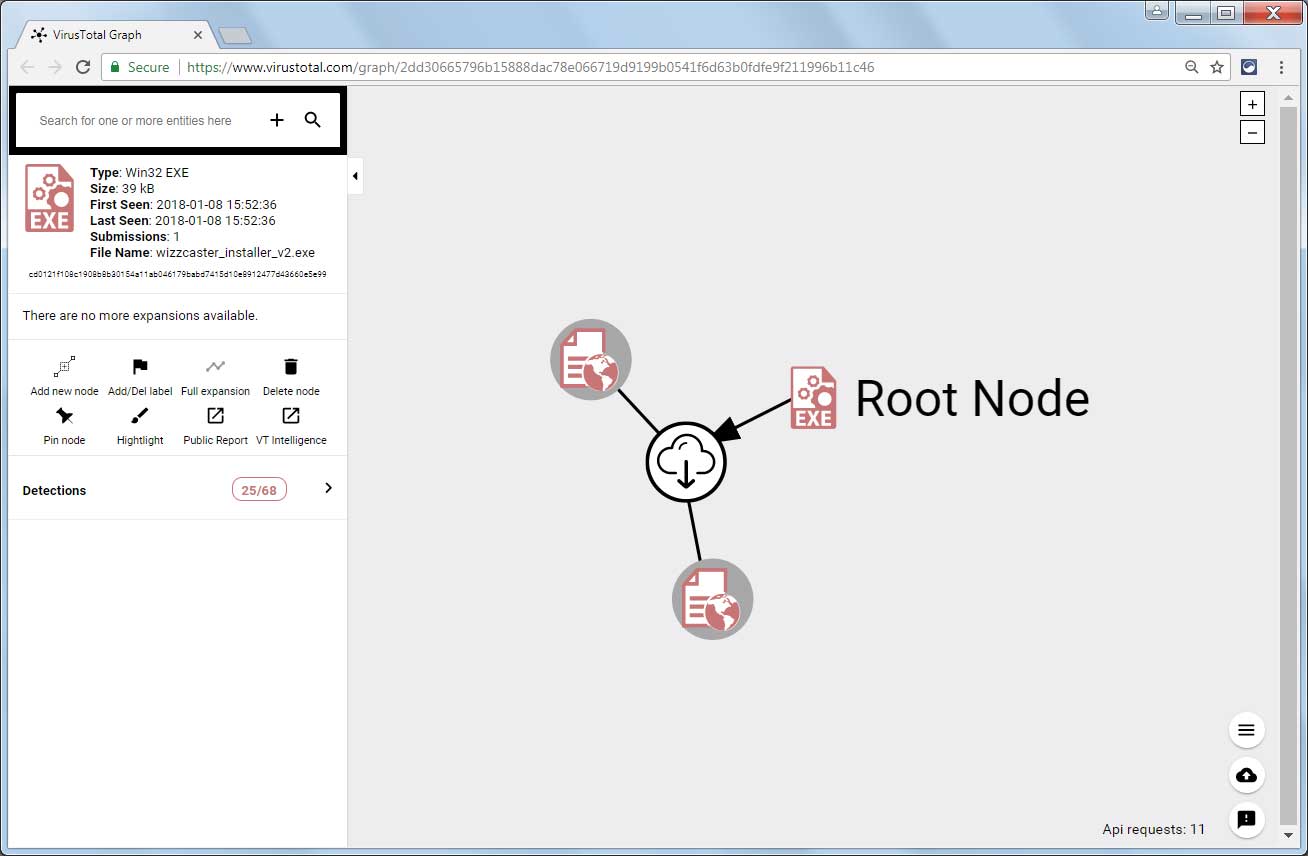
Once at the Graph page, you will see an item called the Root Node. This is the object associated with the file that was submitted to VirusTotal. From this node, you will see various arrows to information related to the sample. For this article, we will take a
look at a simple Graph associated with an adware infection.
This graph contains the Root Node and two URLs it connects to.
VirusTotal Graph

